METHODOLOGY
Big data has the ability to revolutionize the humanitarian sector. Accurate and timely information has traditionally been a main constraint in disaster risk preparation and is of paramount importance to meet the Sustainable Development Goals (SDGs)
Geo spatial information can play an important role in achieving sustainable development and reducing vulnerabilities and deprivations by mapping different dimensions of vulnerability across space and time.
In this study Big Earth data were translated into indicators using the data from the Cambodia Socio-Economic Survey. The indicators were then translated into dimensions which add up an overall vulnerability.
The 17 sustainable development goals.
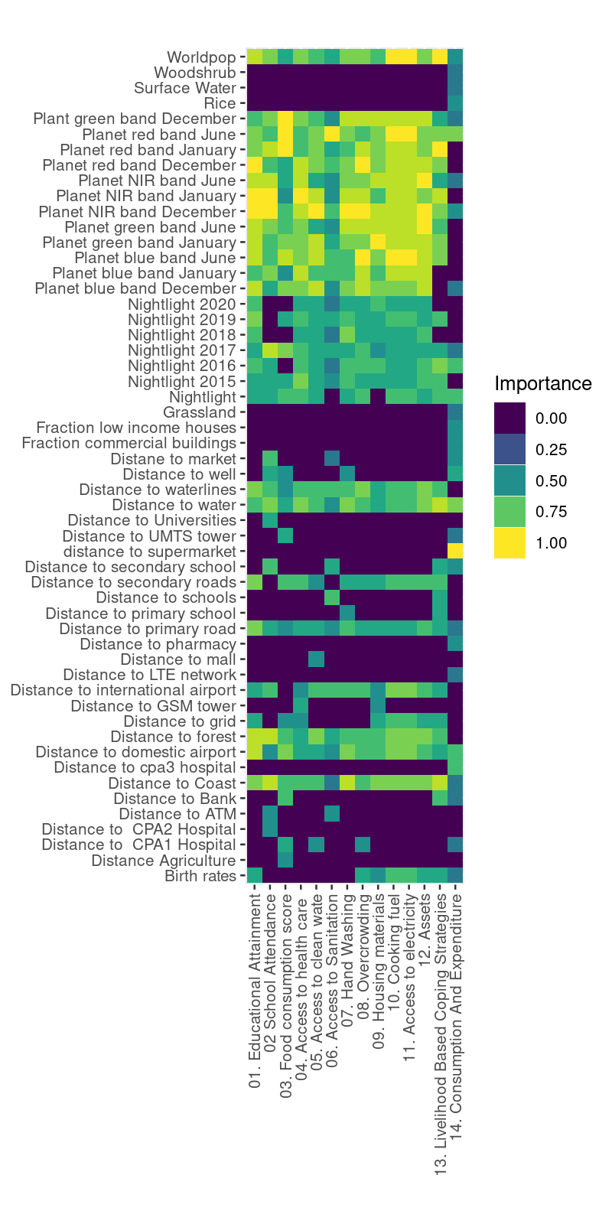
A random forest algorithm was trained with a large number of geo spatial information layers on e.g. distance to roads, electricity grid, nightlights, health facilities, schools, land cover etc and the data from the Cambodia Socio-economic survey. The random forest model was then applied in probability mode to estimate the probability of deprivations across the country on a 100 by 100 meter grid. The variable importance of the different indicators is shown in FIG 1.
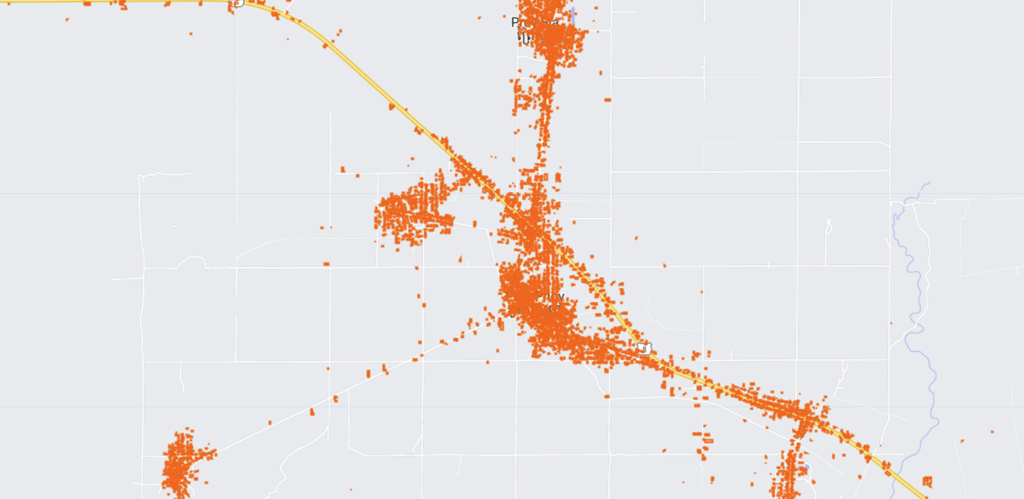
We used the Bing open building footprints dataset to calculate the deprivations per household. This dataset was generated using a machine learning approach on high resolution satellite images. It provides information on the location of buildings in Cambodia.
The image below shows the number of deprivations per household on the country level. This dataset can be explored in more detail in the map section of this website.
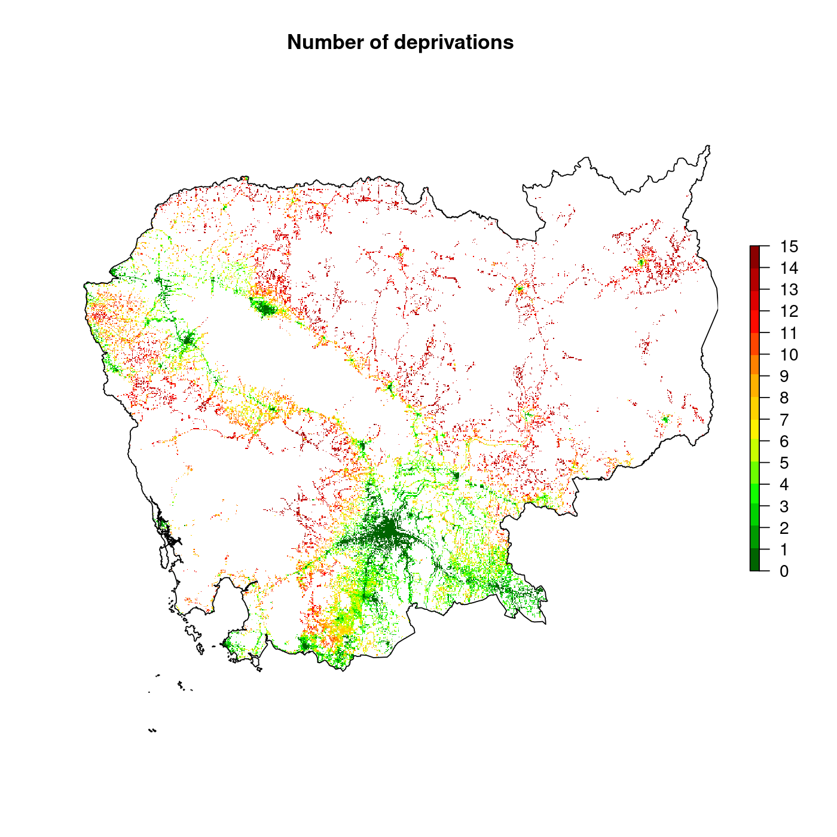
FIG. 1 The variable importance of the different indicators
The dimensions, indicators and definitions of vulnerability.
| Dimension | Indicator | Definition | Weight |
|---|---|---|---|
| Education | Educational Attainment | No member of the household aged 12 years old and older who has completed at least siz year of schooling. | 1/10 |
| School Attendance | At least one child age 6-14 years old as a household member is not currently attending to school. | 1/10 | |
| Health | Food consumption score | Household has Food Consumption Score (FCS) lower than 38.5 during the past week. | 1/25 |
| Access to health care | At least one household member was sick/ill and did not access to health care services in the last 30 days. | 1/25 | |
| Access to clean water | Main source of drinking water is not safe or 30 minutes or longer walk from home (round trip). | 1/25 | |
| Access to sanitation | Household has unimproved or no sanitation facility of it shares the improved sanitation facility with other households. | 1/25 | |
| Hand Washing | There is no observed place of hand washing or soap and water are not observed at an observed place of hand washing. | 1/25 | |
| Living standard | Overcrowding | A room is shared with more than 4 people | 1/30 |
| Housing materials | The naterials of the roof, walls or floors are non-improved (natural or rustic materials). | 1/30 | |
| Cooking fuel | The main source of cooking fuel is natural product (charcoal or wood). | 1/30 | |
| Access to electricity | The household has no access electricity (sources from public electrical grid). | 1/30 | |
| Assets | The household does not own more than two of these assets, radio TV, telephone, computer, refrigerator animal cart, bicycle, motorbike, or machine boat, and does not own car or truck. | 1/30 | |
| Livinhood based on coping strategies | During the past 30 days any household's member has to engage in any of the following activities bacause there was not enough food or lack of money to buy food. | 1/30 | |
| Employment | Unemployment | At least one labor force (aged 15-40 years old) is unemployed. | 1/10 |
| Underemployment | At least one labor force person (aged 15-64 years old), who is currently working does not work full time and would like to work more hours. | 1/10 | |
| Monetary | Consumption and Expenditure | Consumption and expenditure are lower than national poverty line. | 1/5 |